Our Insights dashboard is a dashboard within the dashboard; designed to help you achieve your training goals by providing you with a high-level, visual overview of your Learners' training data.
For more on our brand new data report tool, check out our article here: EasyLlama's Report Builder
You can also use EasyLlama AI to build custom reports and dashboards.For more information, check out our article here: EasyLlama AI: Reporting Assistant
We've made some recent improvements and additions to the Insights tool, so read on to learn more and then click on the Insights and Reports tab of your dashboard to get started!
Filters
Filters can be used to drill down to show data in each section for a more specific set of Learners. They can be accessed by clicking "Show filters" at the top-right of the Insights tab. 
A menu will open at the left side of the dashboard with several options to filter your data. Choose filters from one or more sections and click "Apply" to see the filtered data. If you choose no filters, the data in each widget will apply to all learners. 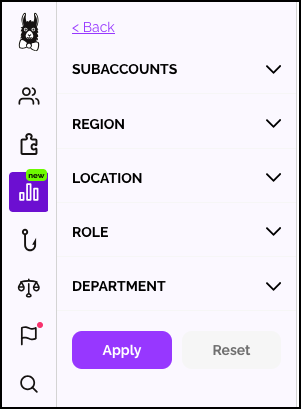
Available filters
- Subaccounts - If you have subaccounts, you'll be able to see the data of each subaccount using this filter.
- Region - filter by training region.
- Location - filter by work Location
- Role - filter by Supervisor or Non-Supervisor
- Department - filter by Department
Insights widgets
Compliance
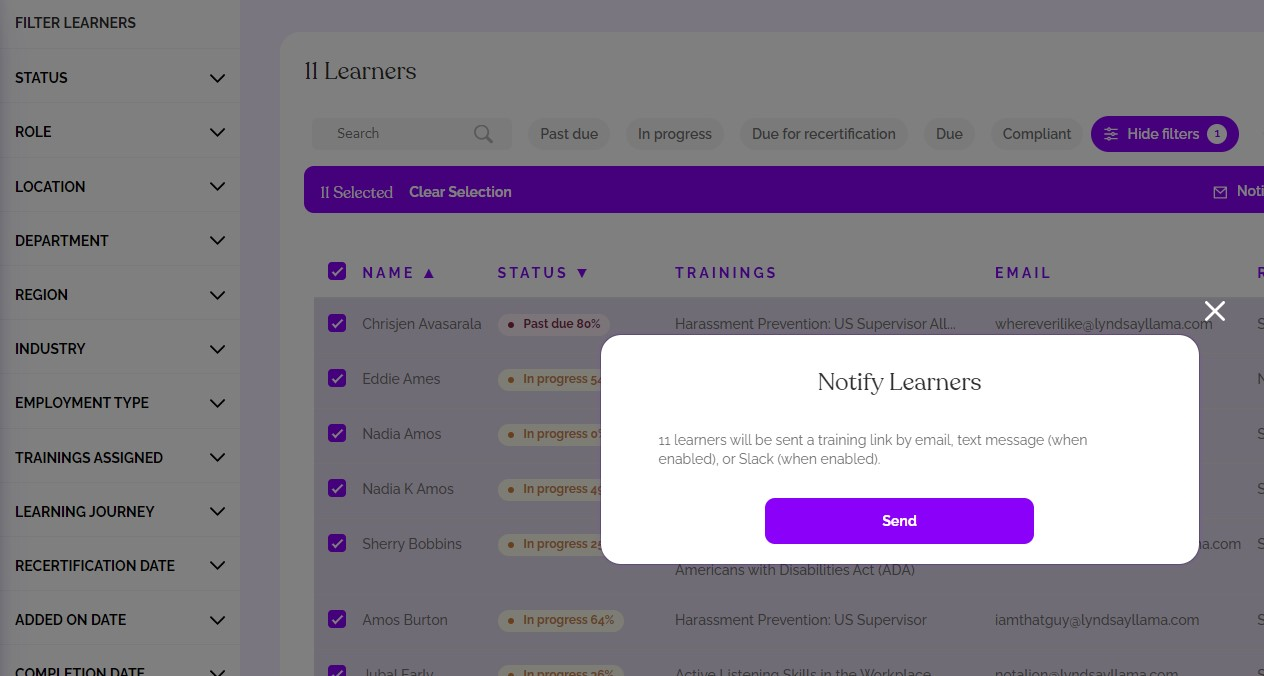
The Compliance Widget shows you, in percentage format, how many of your Learners are in Compliant* status. Clicking the "Notify all non-compliant" button will take you to a list of the non-compliant Learners, where you can review the list and notify them.
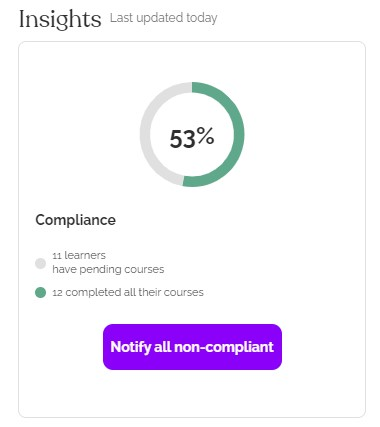
🦙Llama Pro Tip: for the purposes of this widget, a Learner is considered "Compliant" when they have completed all courses that have been assigned to them, regardless of whether these courses are mandated or optional courses.
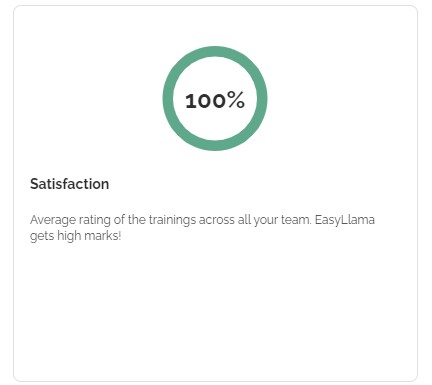
Satisfaction
The Satisfaction widget measures how satisfied your Learners are with the courses they have taken.
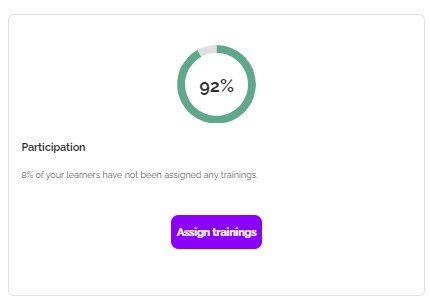
Participation
The Participation widget shows the percentage of Learners who have or have not been assigned courses. You may click the "Assign Trainings" button to see a list of Learners who have not been assigned courses, and assign from there.
Recertifications
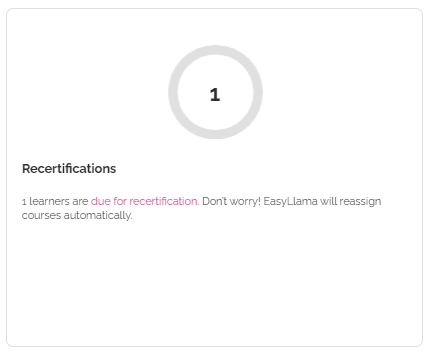
The Recertifications widget shows you how many Learners are due for recertification. This widget will vary depending on whether or not you have Automatic Recertification enabled.
When Automatic Certification is enabled, you will see the number of Learners due to recertify, and a message to remind you that they will be automatically recertified.
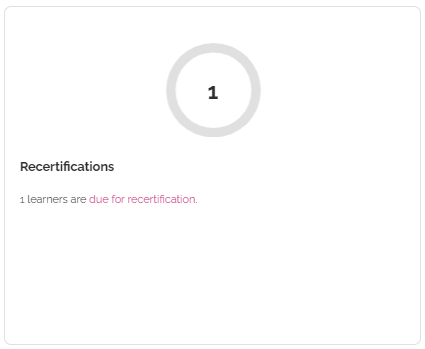
When Automatic Certification is disabled, you'll see a message letting you know how many Learners are due to recertify.
In either case, the words "due for recertification" are clickable, and will take you to a list of the Learners who are due to recertify. You can recertify them from this list, if you wish.
Automatic Recertification on:
Automatic Recertification Off:
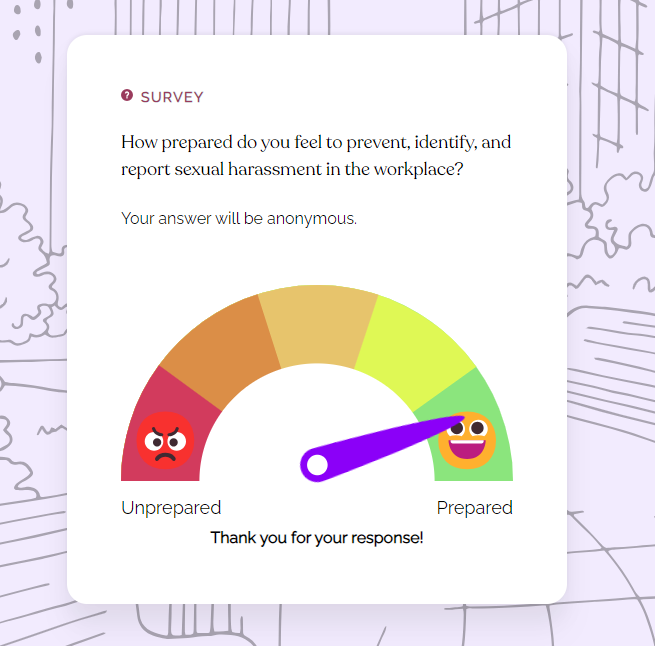
Overall Impact Score
This score measure the impact of EasyLlama's compliance courses on your Learners.
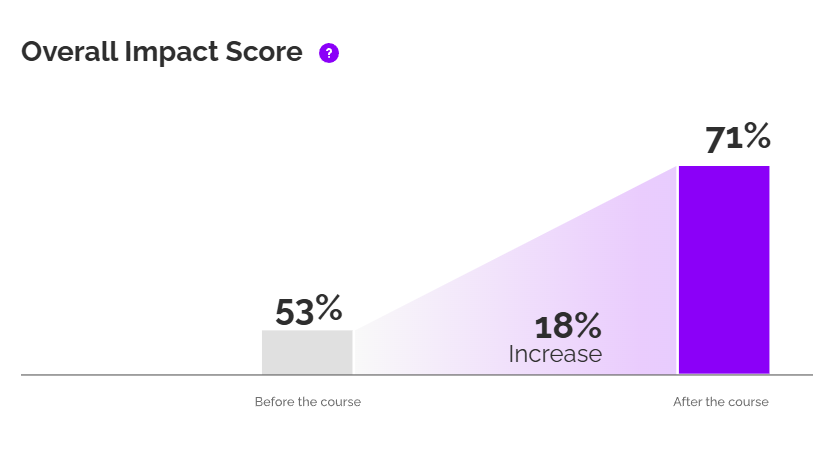
Impact Score corresponds to in-course gauge slides and other measurement-based slides that appear in select courses. These appear at the beginning and end of a course and ask the Learner about their understanding or knowledge of the course topic before and after taking the course.
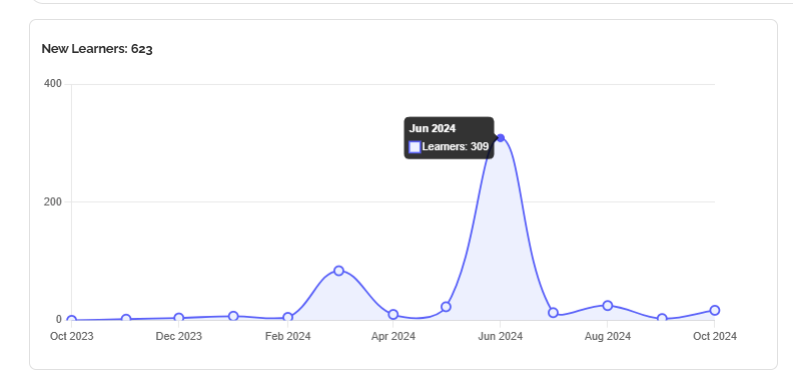
New Learners and Active Learners
This section of the dashboard allows you to see data on newly added and active Learners for the preceding 12 months.
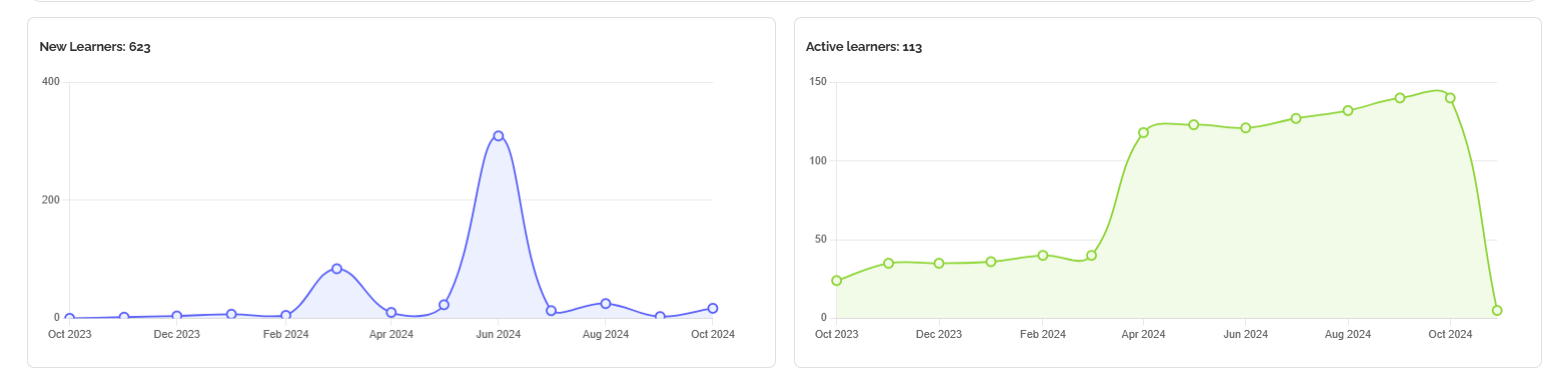
Click on data points for more details.
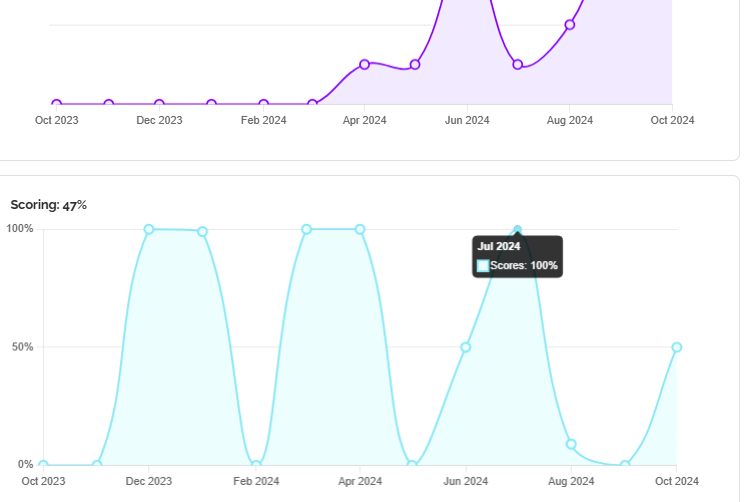
Trends Overview
Select a date range at the top-right of the section and choose between courses and Learning Journeys at the top of the Assignments or Completions chart to see trends over time.
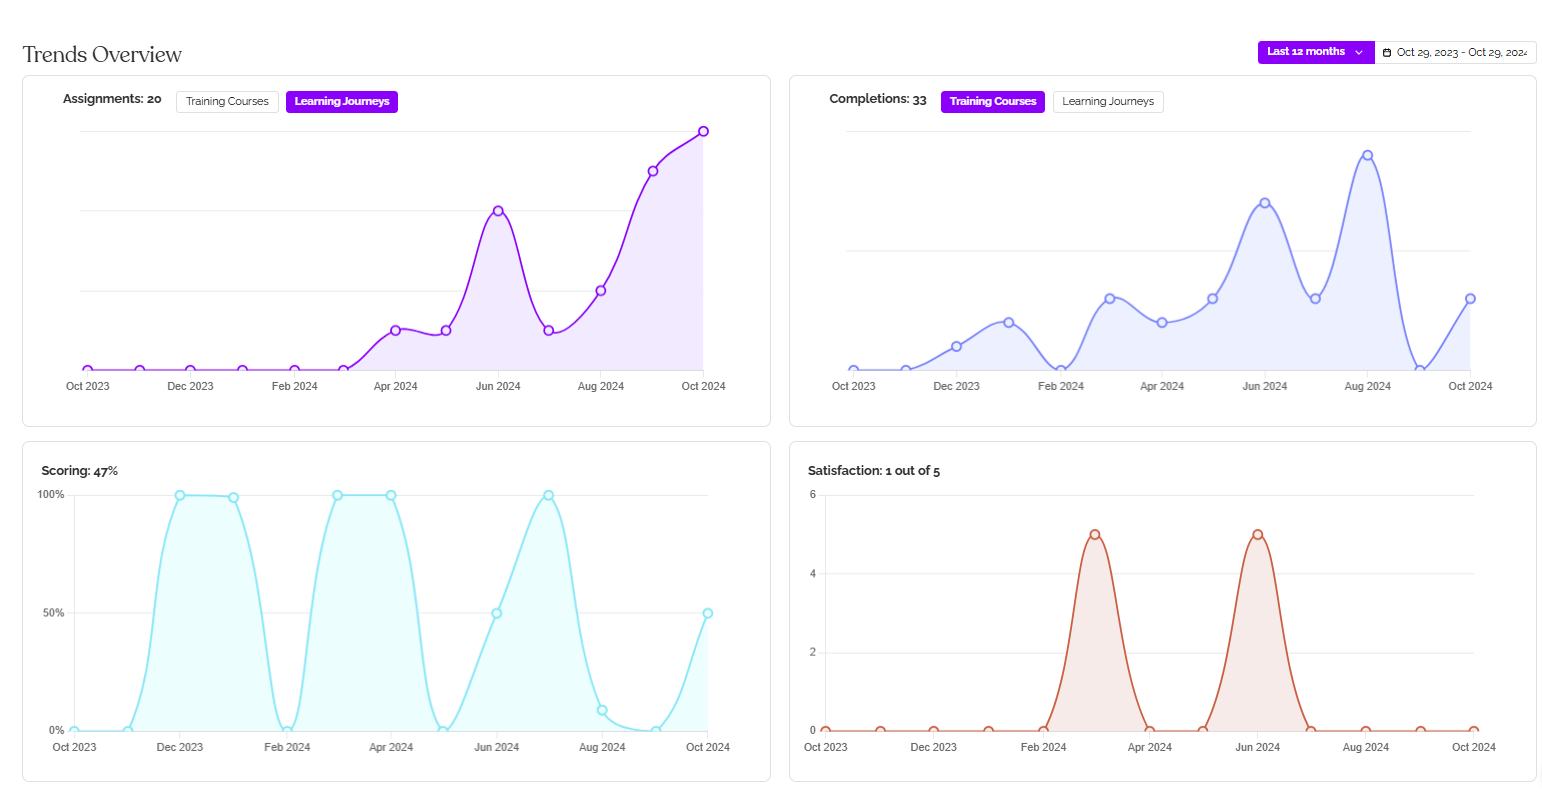
Click on the data points to see more information.
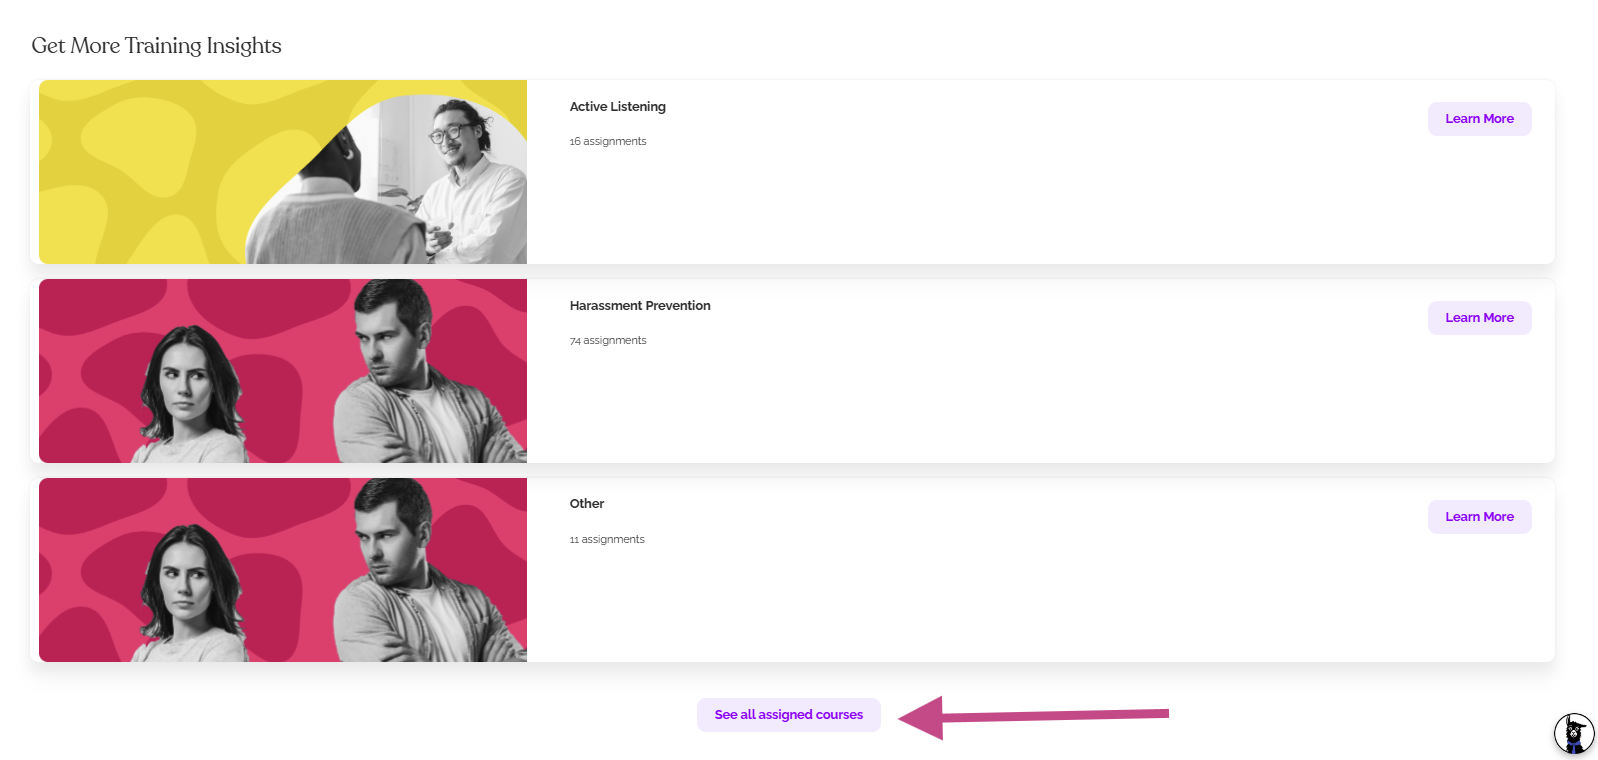
Get More Training Insights
This is a powerful section that will allow you to drill down further into specific courses. Click on any of the featured courses, or click "See All Assigned Courses at the bottom of the page if you want to see data for another course.
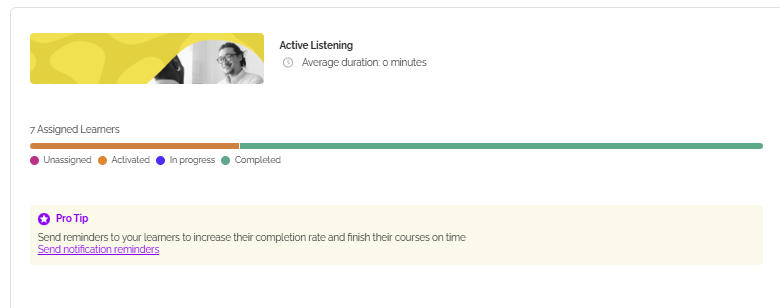
After clicking on a specific course, you will see a Training Overview dashboard for that course with more details for the selected course. You can use filters and date ranges, and click data points just like you can on the overview dashboard, and you can switch between courses by clicking the dropdown at the top-right.
One great addition for the course-specific dashboard is an overview of course completion! You can hover over the colored bar sections to see exactly how many Learners are in each stage. Here's an example for the Active Listening course:
We hope you'll click around to explore and enjoy this improvement to data visibility!